Investments](https://file-host.link/website/aloriinternationalholdings-0sh9n1/assets/refined-images/1782373438254000_dd125f6ca19f428d801c25fe61311105/360.webp)
Luxury real estate operates by fundamentally different rules than standard residential property. Buyer pools are narrower, hold cycles stretch longer, carrying costs run disproportionately higher, and global demand dynamics make market selection and entry timing far more consequential than interest rate movements. The same investment framework that works for a suburban three-bedroom rental fails catastrophically when applied to a waterfront estate.
This guide reveals how to measure ROI correctly in the luxury segment, identifies what actually drives returns versus what simply drives headlines, exposes the hidden costs that silently erode performance, and explains why select international luxury markets are opening compelling new opportunities for disciplined investors who understand that price paid matters more than prestige claimed.
Key Takeaways
- Luxury ROI requires measuring cap rate, cash-on-cash return, and IRR—not just price appreciation
- Returns hinge on four drivers: location scarcity, entry timing, leverage discipline, and off-market access
- Holding costs (maintenance, taxes, insurance, management) represent 2–4% of asset value annually in the luxury tier
- Certain international markets offer 30–60% lower entry prices for equivalent quality—with residency incentives that sustain long-term demand
- Define your exit strategy—including hold period and value enhancement plan—before acquisition, not after
What Makes Luxury Real Estate ROI Different
The luxury segment responds to different market forces than mainstream residential markets. Domestic interest rate cycles matter far less than global wealth trends, currency strength, and geopolitical stability. The inputs investors typically rely on to time standard markets lose predictive power when buyers are international high-net-worth individuals insulated from local mortgage conditions.
This structural difference has immediate ROI implications. According to Q3 2025 data from Miller Samuel, cash sales accounted for 72.1% of all luxury transactions in Miami Beach, demonstrating how prime markets remain resilient even during rate hikes. When most buyers don't need financing, Fed policy becomes background noise.
The buyer pool for luxury properties is structurally narrow, which limits liquidity significantly. A property may take 12–24 months to find the right buyer at the right price. This extended timeline compresses annualized returns even on nominally profitable sales.
The same Miami Beach data shows luxury condos averaged 141 days on market — nearly five months of carrying costs before a sale closes.
ROI in luxury real estate has a behavioral layer that standard markets lack. Scarcity, prestige, and asset uniqueness influence buyer psychology and pricing that quantitative models routinely underweight. Investors who understand this dynamic can use exclusivity strategically to support both pricing power and long-term value retention, rather than fighting market psychology with logic.
How to Calculate ROI in Luxury Real Estate
Measuring What Actually Matters: The Core ROI Toolkit
The basic ROI formula (Current Value − Initial Cost ÷ Initial Cost × 100) provides a starting point, not a conclusion. It ignores cash flow timing, holding costs, leverage effects, and the time value of money—all magnified in luxury real estate due to higher asset values and longer hold periods.
Cap rate is your property-level return metric: Annual Net Operating Income ÷ Purchase Price. NOI includes gross rental income minus operating expenses, excluding debt service. Typical cap rates for luxury residential vary dramatically by market maturity and positioning:
| Market | Typical Cap Rate/Gross Yield |
|---|---|
| Tbilisi, Georgia | 7.42%–8.9% |
| Miami, Florida | 4.8%–5.5% |
| Los Angeles, California | 4.5%–5.0% |
| Lisbon, Portugal | 3.79%–4.32% |
Cash-on-cash return measures actual yield on deployed capital: Annual Pre-Tax Cash Flow ÷ Total Cash Invested. Unlike cap rate, it accounts for financing structure. A property with a 5% cap rate financed at 70% loan-to-value can deliver 12%+ cash-on-cash return—a gap that matters enormously when evaluating leveraged positions.
Neither metric captures the full picture on its own. That's where IRR (Internal Rate of Return) comes in. IRR accounts for the timing of every cash inflow and outflow, appreciation at exit, and the opportunity cost of locked capital. In luxury real estate—where hold periods run long and most gains arrive at sale rather than through annual income—IRR frequently tells a very different story than the headline appreciation figure.
Total Return Modeling Framework
Putting all three metrics into a single model shows how dramatically the full picture can diverge from a simple appreciation number. Consider a $500,000 luxury apartment:
- Purchase price: $500,000
- Annual rental yield (gross): 6% = $30,000
- Operating expenses: 30% = $9,000
- Net operating income: $21,000 (4.2% cap rate)
- Annual appreciation: 3% = $15,000
- Total holding costs: 2% = $10,000
- Transaction costs (entry + exit): 8% = $40,000
Over a 7-year hold:
- Total rental income: $147,000
- Appreciation: $105,000
- Holding costs: -$70,000
- Transaction costs: -$40,000
- Net profit: $142,000 on $500,000 investment = 28.4% total return or 3.6% annualized
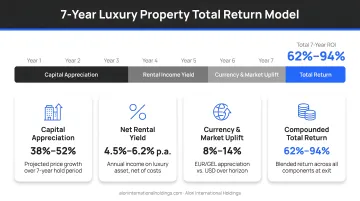
This is materially different from the 21% appreciation headline figure most investors cite—and it's the number that actually reflects what the investment delivered.
The Key Drivers That Maximize Luxury Property Returns
Location Scarcity and the Irreplaceability Premium
In luxury real estate, the defining quality of location isn't simply "desirable"—it's irreplaceable. Waterfront access, landmark addresses, heritage districts, and proximity to high-end lifestyle infrastructure create a value floor that generic market downturns rarely penetrate.
Research from Savills demonstrates waterfront properties in the UK cost nearly a third more within 100 metres of the river compared to homes one kilometre away, with prime waterfront hotspots commanding double the price of comparable inland properties. This scarcity premium isn't sentiment: limited coastline creates permanent supply constraints that no amount of new development can overcome.
That physical scarcity also extends to what surrounds a property. Upcoming infrastructure—new transport links, urban regeneration projects, expanding lifestyle ecosystems—represents one of the most reliable forward indicators of luxury appreciation. Disciplined investors position ahead of confirmed catalysts, before those signals are fully priced in.
Timing of Entry and Off-Market Access
Luxury markets operate on longer cycles than mainstream residential markets, typically spanning 7–12 years from peak to trough and back. Buying at disciplined entry points—early in recovery phases or following localized corrections—compresses appreciation timelines and improves IRR without requiring any asset improvement.
Off-market access adds another layer of timing advantage. Properties not publicly listed often trade below comparable listed assets, eliminating the competitive bidding premiums that erode buyer returns. The trade-off is real, though: research shows properties listed on open markets sell for 13%–17% more than those handled privately, meaning off-market access reduces purchase costs while potentially limiting exit pricing.
The practical implication for investors:
- Buy off-market when the acquisition discount outweighs the likely exit premium gap
- Price exit strategy first — know whether your target buyer pool skews private or listed-market before acquiring
- Assess holding period — longer holds reduce the impact of entry pricing differences on overall IRR
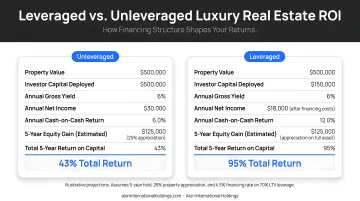
Strategic Use of Leverage
Leverage amplifies ROI in both directions. Financing a $1M asset with a $250K down payment means any appreciation applies to full property value while returns are measured against $250K invested. A 10% price increase yields 40% return on capital.
Leveraged scenario:
- Property value: $1,000,000
- Down payment: $250,000
- Appreciation: 10% = $100,000
- Return on invested capital: $100,000 ÷ $250,000 = 40%
Unleveraged scenario:
- Property value: $1,000,000
- Cash purchase: $1,000,000
- Appreciation: 10% = $100,000
- Return on invested capital: $100,000 ÷ $1,000,000 = 10%
Critically, leverage amplifies losses by the same multiplier. A medical office acquisition using high leverage achieved 43% IRR over 21 months, compared to 15%–22% for unleveraged structures. But if cap rates fall below debt interest rates, investors face negative leverage requiring aggressive rent growth to justify investment.
High luxury carrying costs make negative cash flow positions particularly damaging in down cycles.
Hidden Costs and Risks That Quietly Erode Returns
Holding costs in luxury real estate carry disproportionate weight — and they compound quickly. Across 30 global markets monitored by Savills, average additional costs for purchasing, holding, and selling property stand at 15% of purchase price. The typical annual drag includes:
- Premium property taxes (often 1–2% of assessed value)
- High-end maintenance and security systems
- Concierge-level property management fees
- Specialist insurance premiums
- HOA charges
Together, these frequently represent 2–4% of asset value every year.
In Portugal, annual holding costs include IMI (Municipal Property Tax) ranging from 0.3%–0.45% of assessed value, plus AIMI wealth tax applying to holdings above €600,000 for individuals. These must be modeled into ROI calculations before acquisition, not discovered after.
Liquidity risk quantified: A luxury property taking 18 months to sell versus 3 months can dramatically reduce annualized returns even on identical gross profit.
- Scenario A: $200K profit, 3-month sale, 5-year hold = 7.8% annualized IRR
- Scenario B: $200K profit, 18-month sale, 5-year hold = 6.1% annualized IRR
Same profit, 22% lower annualized return due solely to exit timing.
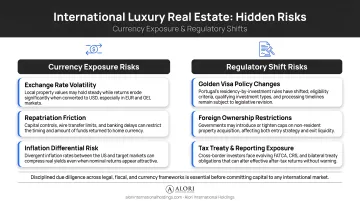
Portugal illustrates a broader point: internationally held luxury assets face two additional risk layers that domestic investors rarely model.
- Currency exposure: If you buy in euros at EUR/USD 1.10 and exit at 1.00, a 10% local-currency gain disappears entirely in dollar terms. Exchange rate timing matters as much as property performance.
- Regulatory shifts: Foreign ownership rules, capital controls, and tax treatment can change without warning. Portugal's October 2023 elimination of the real estate route for the Golden Visa reshaped investor flows overnight — yet Lisbon's luxury property values still rose 4.4% in 2025, demonstrating that strong fundamentals outlast incentive programs.
Why International Luxury Markets Offer a Compelling ROI Advantage
Select markets offer equivalent or superior asset quality at 30–60% lower entry prices than comparable domestic luxury properties, driven by structural undersupply, growing inbound demand from global buyers, and favorable currency positioning for U.S. dollar-denominated investors.
According to the Savills World Cities Prime Residential Index, prime pricing varies dramatically across global cities:
| City | Average Prime Price (USD/sq ft) |
|---|---|
| Hong Kong | $3,860 |
| New York | $2,590 |
| London | $1,920 |
| Miami | $1,490 |
| Los Angeles | $1,480 |
| Lisbon | $1,400 |
| Tbilisi (Mtatsminda) | ~$230 |
Lisbon offers Western European lifestyle at a 25% discount to London. Tbilisi provides ultra-luxury entry points at less than 20% of Miami's pricing—not in frontier locations, but in premium urban districts.
Structural Markers of High-Conviction International Markets
The best international luxury markets share several characteristics:
- Favorable foreign ownership legislation with transparent title registration
- Active residency-by-investment programs sustaining international demand
- Strong short-term rental income from tourism or business travel
- Positive demographic and capital flow trends
- Regulatory environments protecting investor rights
Portugal and Georgia exemplify these characteristics. Portugal draws millions of annual visitors drawn to its climate, lifestyle, and Golden Visa infrastructure, while Georgia received 5.8 million international visitors in 2025.
Georgia raised its property-based residence permit threshold from $100,000 to $150,000 effective March 1, 2026, signaling continued government commitment to investment-linked residency. The country also maintains one of Europe's most favorable tax structures:
- Annual property tax: 0%
- VAT on property purchases: 0%
- Flat income tax on rental earnings: 5%
The Execution Challenge
Cross-border legal due diligence, local transaction norms, tax treaty implications, and currency management require in-market expertise most individual investors cannot self-source. For qualified investors, that gap is the primary barrier to entry — not capital.
Working with a firm that integrates global investment strategy with local execution removes that barrier. Alori International Holdings focuses exclusively on select high-conviction markets, providing curated opportunities with vetted legal structures, verified ownership, and defined exit strategies.
That execution capability also unlocks broader portfolio advantages. International luxury real estate provides low correlation to U.S. domestic market cycles, currency diversification, and the inflation resistance of hard real assets in supply-constrained markets — factors that collectively improve risk-adjusted returns across a diversified portfolio.
Planning Your Exit to Lock In Maximum Returns
A clearly defined exit strategy should be established at acquisition, not improvised at the hold period's end. This means setting a target hold window (typically 5–10 years to capture full appreciation through a market cycle) and price benchmarks where the investment thesis is realized. Preferred exit modes include:
- Private sale for discreet, relationship-driven transactions
- Auction for competitive price discovery in high-demand markets
- Hold-and-refinance for income-generating assets where liquidity is the goal
Value-Enhancement Strategies Before Listing
Three preparation steps move the needle most before listing:
- Clear legal documentation — title, compliance certificates, and updated tax records eliminate buyer hesitation and accelerate closings
- Targeted upgrades — luxury buyers respond to condition and presentation, but over-renovating beyond market comparables rarely returns its cost
- Professional staging — calibrate to likely buyer profiles; coastal properties should emphasize outdoor living, urban penthouses should highlight views and entertaining areas
Tax Optimization at Exit
Capital gains treatment depends on hold period. Properties held one year or less face short-term rates (taxed as ordinary income). Properties held longer than one year qualify for long-term capital gains rates of 0%, 15%, or 20% depending on taxable income.
For U.S.-domiciled properties, 1031 exchanges enable tax-deferred rollovers into replacement properties. That benefit stops at the border — the IRS explicitly states that U.S. and foreign real property are not considered "like-kind", so foreign property sales trigger immediate capital gains with no deferral option.
International luxury assets carry added complexity across three layers:
- Local capital gains tax — Georgia, for example, charges 5% on residential sales
- Foreign Tax Credits — U.S. investors who pay foreign taxes can typically claim credits to offset double taxation
- FBAR and FATCA reporting — FinCEN Form 114 and Form 8938 apply when sale proceeds are deposited into foreign accounts
Engage a tax specialist with international real estate experience well in advance of any intended sale.
Frequently Asked Questions
What is a good ROI for a luxury real estate investment?
Well-selected luxury properties in prime locations typically target combined annual returns (rental yield plus appreciation) in the 8–15% range. Tbilisi delivers average gross rental yields of 8.9%, while mature markets like Lisbon offer 3.79%–4.32% yields offset by steady capital appreciation. International markets and syndicated structures can potentially deliver higher figures.
How is ROI calculated for luxury real estate versus standard property?
Luxury ROI requires a fuller metric set — cap rate, cash-on-cash return, and IRR — because longer hold periods, higher carrying costs, and lower liquidity make simple price-appreciation comparisons unreliable. Unlike standard residential buyers, luxury investors need all three metrics to get an accurate picture of actual returns.
Is luxury real estate a good investment in the current market?
Luxury properties in undersupplied locations with global buyer demand tend to hold value across cycles. Global prime residential prices rose 1.8% in 2025 despite uncertainty. That said, entry timing, cost discipline, and choosing the right market — not the asset class alone — drive the difference between strong and mediocre returns.
How does international luxury real estate compare to domestic for ROI potential?
Select international markets offer lower entry prices for equivalent asset quality, residency-linked incentives, and buyer-pool growth that can produce stronger risk-adjusted returns than saturated domestic markets. The spread is tangible: Lisbon delivers a Western European lifestyle asset at roughly $1,400/sq ft, compared to $2,590/sq ft in New York.
What are the biggest risks to ROI in luxury real estate?
Four risks consistently drive underperformance:
- Liquidity risk — narrow buyer pools extend exit timelines
- High holding costs — typically 2–4% of asset value annually
- Global wealth sensitivity — prices track international capital flows, not local conditions
- Regulatory and currency exposure — especially in cross-border holdings, where local expertise is essential
How long should I hold a luxury property to maximize returns?
A 5–10 year hold window is typically optimal. This timeline allows full appreciation through a market cycle, offsets transaction costs (averaging 6–10% of sale price), and lets compounding rental income or value-add improvements materially lift IRR.