
Introduction
Most real estate investors underestimate expenses and overestimate income — and in international markets, that gap between projected and actual returns can be significant. The forecasts that hold up over time aren't more complex; they're built on better inputs, honest assumptions, and market-specific data.
Most investors lose accuracy before the analysis even begins — relying on optimistic seller projections, generic benchmarks, and domestic assumptions that don't hold in foreign markets.
This guide covers the data you need, how to build reliable projections step by step, the variables that move the needle most, and the errors that consistently produce bad forecasts.
Key Takeaways
- Net cash flow equals gross rental income minus vacancy losses, operating expenses, debt service, and CapEx reserves
- Verify all seller-provided figures independently: pro formas consistently understate expenses and overstate rents
- Follow four core steps: validate income data, model expenses and CapEx, account for debt service, and stress test
- Vacancy rate, operating expense ratio, financing costs, and local rent growth trends determine forecast accuracy
- Avoid the three most common forecasting errors: skipping CapEx reserves, using optimistic vacancy assumptions, and applying domestic benchmarks to international properties
How to Forecast Cash Flow for Real Estate Investments
Step 1: Gather and Validate Your Income Data
Start by identifying all income streams beyond base rent:
- Parking fees and storage surcharges
- Laundry or utility reimbursements
- Short-term rental premiums for furnished units
- Property-specific amenities (pool access, concierge services)
Next, apply realistic vacancy and credit loss adjustments. Stable markets typically warrant 5–10% adjustments, while transitional or international markets require higher reserves to convert gross scheduled income into effective gross income (EGI).
Critical warning: If evaluating an acquisition, verify seller-provided pro formas against independent market data. Sellers routinely misrepresent both income potential and operating expenses. Obtain historical rent rolls, lease expiration schedules, and actual collected rent data—not projections.
Step 2: Model Operating Expenses and Capital Expenditures
List all recurring operating expenses using historical data where available:
- Property management fees (typically 8–12% of gross income)
- Insurance premiums
- Property taxes or municipal charges
- Maintenance and repairs
- Utilities not passed through to tenants
- HOA or service charges
Separate capital expenditures from operating costs. CapEx covers major replacements (roof, HVAC, appliances) and should be excluded from Net Operating Income calculations but deducted from final net cash flow. Experienced investors typically reserve 1–2% of property value annually or 5–10% of gross rental income for CapEx.
For older properties or unfamiliar markets, build in contingency buffers. Insurance and maintenance costs in international markets like Georgia or Portugal often differ from U.S. benchmarks in ways that catch foreign buyers off guard—local expertise is the only reliable way to size these line items accurately.
Step 3: Account for Financing Costs and Debt Service
With expenses modeled, map every loan obligation by property:
- Principal and interest payments
- Balloon payment schedules
- Variable-rate adjustment triggers
Calculate the Debt Service Coverage Ratio (DSCR) to confirm the property meets lender thresholds. Most lenders require a minimum DSCR of 1.20–1.25x, meaning your Net Operating Income should exceed annual debt service by at least 20–25%.
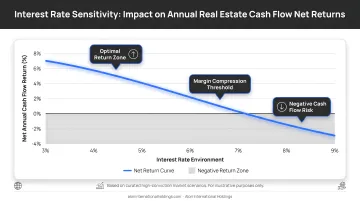
Model interest rate sensitivity for adjustable-rate mortgages or cross-border financing structures common in international transactions. A 150–200 basis point rate increase can compress net cash flow margins by 15–25%—enough to flip a marginally positive deal into negative territory.
Step 4: Build Scenario Projections and Stress Test
Construct three scenarios minimum:
| Scenario | Vacancy Adjustment | Expense Adjustment | Rent Assumption |
|---|---|---|---|
| Base Case | Market-rate vacancy | Verified historical costs | Submarket rent growth |
| Downside Case | +3–5 percentage points | +10–15% | Flat or declining |
| Stress Case | Prolonged vacancy period | Maximum reserve draw | 10–20% rent decline + 200+ bps rate spike |
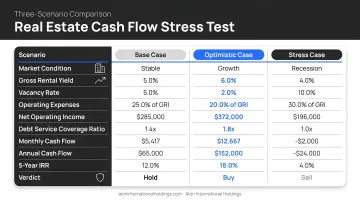
For the stress case, identify the exact point where cash flow turns negative and whether your reserves cover the shortfall period.
If the property can't sustain the stress case for at least 6–12 months on reserves alone, either increase your capital cushion before closing or walk away. The scenario math tells you this before you're committed.
What You Need Before Building Your Cash Flow Forecast
The quality of your forecast depends entirely on input quality. Garbage in, garbage out applies directly here.
The quality of your forecast depends entirely on input quality — and that means gathering two distinct categories of data before you build a single projection: property-level documentation and market context.
Data and Documentation Requirements
Obtain minimum 12–24 months of historical operating statements for existing properties. For acquisitions, require:
- Detailed rent rolls showing unit-by-unit income
- Lease expiration schedules
- Utility bills and maintenance logs
- Property tax assessments
- Insurance premium history
Verify all figures independently against market comparables and local data sources. Seller-provided numbers are a starting point, not a conclusion.
Market and Regulatory Context
Documentation alone isn't enough for cross-border deals. International properties require country-specific data that domestic benchmarks simply don't capture:
- Local vacancy norms by property type and submarket
- Currency exposure considerations and hedging costs
- Foreign ownership regulations and transaction requirements
- Restrictions on repatriating rental income or sale proceeds
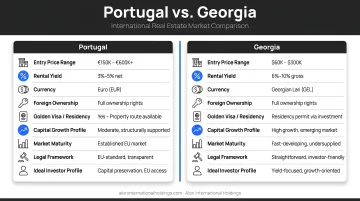
- Tax treatment differences (Portugal's IMI property tax vs. Georgia's 0% property tax structure)
Applying U.S. domestic assumptions to markets like Portugal or Georgia doesn't produce conservative estimates — it produces the wrong ones entirely. This is where local expertise moves from a nice-to-have to a prerequisite.
Key Variables That Affect Your Real Estate Cash Flow Forecast
The formula itself rarely causes a forecast to fail. What does? Poorly estimated inputs. Each variable below can swing net cash flow significantly — and knowing where the real risk lives is what separates accurate projections from wishful thinking.
Vacancy Rate
Vacancy is the single most sensitive variable in the income model. Even a 1–2% shift materially changes annual net cash flow and affects how a property is valued.
Rates vary dramatically across asset classes and geographies. Urban markets with diversified employment tend to run lower vacancy than single-industry towns. International markets add another layer — Tbilisi's rental market saw rents spike 35% year-over-year in 2023, then correct downward by 10% in 2025 as migration patterns normalized. That kind of swing can wreck a forecast built on static assumptions.
Use submarket-specific data, not national averages. A 5% vacancy assumption may be reasonable for a stable Lisbon neighborhood but dangerously low for an emerging Tbilisi submarket.
Operating Expense Ratio
Operating expenses typically consume 35–50% of gross rental income — and underestimating them is the most common reason real-world returns fall short of projections.
Where you land in that range depends on several factors:
- Older properties and furnished units trend toward the higher end
- New construction in low-tax jurisdictions can operate below 35%
- Aging buildings in high-cost markets can push past 50%
For international properties, verify ratios using local data. Georgia's 0% property tax structure produces a very different expense profile than Portugal's IMI regime — and that difference flows directly into net cash flow.
Financing Terms and Interest Rate Sensitivity
Debt service is often the largest single line item in a cash flow model. Rate changes don't just affect payments — they compress or expand net margins across the entire hold period.
Consider a $300,000 property financed at 70% LTV ($210,000 loan):
| Rate | Monthly Payment | Annual Debt Service |
|---|---|---|
| 5% (30-yr fixed) | $1,127 | $13,524 |
| 7% (30-yr fixed) | $1,398 | $16,776 |
That 200 basis point increase cuts annual net cash flow by $3,252 — before accounting for any other changes. The gap widens further with adjustable-rate mortgages or cross-border financing, where rate risk is harder to lock in. Run multiple rate scenarios before committing to any projection.
Local Market Rent Growth and Cap Rate Trends
Rent growth assumptions drive 3–5 year forecast trajectories, and using national averages instead of submarket data is a reliable way to build a misleading model.
Cap rate movement matters just as much. Compression boosts exit valuations but can signal overheating; expansion in emerging markets signals stronger current cash flow but potentially slower appreciation. Understanding which direction a market is moving — and why — shapes both your entry thesis and your exit assumptions.
The gap between markets can be striking. Despite recent rent corrections, Tbilisi residential properties currently generate gross rental yields of 8.3% to 8.6%, well above the 3.6% to 4.5% typical of Eastern and Western European capitals. That yield advantage is real — but it comes with local market volatility and currency risk that need to be priced into the model.
Common Mistakes When Forecasting Real Estate Cash Flow
Most forecast errors stem from flawed assumptions or skipped inputs, not model structure.
Using Seller Pro Formas Without Independent Verification
Sellers understate expenses and overstate rents to maximize sale price. Accepting these figures without verification guarantees forecast failure.
Independently verify all figures before building your model:
- Cross-reference claimed rents with local rental platforms and comparable listings
- Verify expense categories against utility bills and maintenance logs
- Confirm property tax assessments with municipal records
Omitting CapEx from the Net Cash Flow Calculation
Many investors exclude capital expenditure reserves from forecasts, making properties appear more profitable than reality. This confusion stems from conflating Net Operating Income (NOI) with net cash flow.
Critical distinction: NOI excludes CapEx and debt service—it measures property operating performance. Net cash flow deducts both CapEx reserves and debt service from NOI, revealing true investor returns.
Without CapEx reserves, investors face unexpected capital calls when roofs fail, HVAC systems die, or appliances need replacement. This omission is especially dangerous for older properties requiring more frequent major repairs.
Applying Domestic Assumptions to International Properties
Vacancy norms, maintenance cost structures, property tax regimes, and currency effects behave differently in international markets. Using U.S.-based benchmarks for properties in markets like Portugal or Georgia produces unreliable results.
Examples of material differences:
- Taxation: Portugal charges IMI property tax (0.3–0.45% of cadastral value) while Georgia charges 0% annual property tax
- Transaction costs: Foreign ownership regulations, currency conversion fees, and legal requirements vary by jurisdiction
- Rental dynamics: Tourism-driven markets experience seasonal vacancy patterns that don't match traditional residential assumptions
- Repatriation: Some markets impose restrictions or taxation on transferring rental income or sale proceeds across borders
Working with locally-informed partners reduces this risk by providing market-specific benchmarks, regulatory guidance, and verified expense data.
Forecasting Only One Scenario
Single-scenario models cannot reveal downside exposure. Without stress testing, investors have no visibility into minimum conditions required for the investment to remain cash flow positive.
Always model at least three scenarios: base, downside, and stress. Identify the breaking point where the property generates negative cash flow and confirm reserves can sustain operations for 6–12 months during adverse conditions.
Conclusion
Accurate cash flow forecasting comes down to discipline: verified data, conservative assumptions, and scenario-based thinking—applied consistently before capital moves.
Reliable forecasts require accounting for all income streams, all expense categories (including CapEx), and market-specific variables—especially in international markets where local conditions deviate sharply from domestic norms. Markets like Portugal and Georgia offer compelling yield opportunities but operate under distinct regulatory, tax, and operational frameworks that demand localized analysis.
Most forecasting failures trace back to optimistic inputs or missing line items. The discipline to stress-test projections before committing capital separates investors who build durable portfolios from those caught off guard by predictable challenges.
Three habits define investors who get this right:
- Verify independently — don't rely on seller-provided figures for vacancy rates, rental income, or operating costs
- Model the downside — run a scenario where occupancy drops 15–20% before deciding if the numbers still work
- Account for every line item — CapEx reserves, management fees, and tax drag are where forecasts quietly fall apart
Applied together, these habits shift forecasting from educated guessing into a repeatable decision-making process.
Frequently Asked Questions
What is considered good cash flow for a real estate investment?
A common benchmark targets 6–10% annual cash-on-cash return, though "good" depends heavily on asset type, market, and leverage level. Stabilized residential properties in established markets typically generate lower returns than emerging-market opportunities with higher risk profiles.
How do you calculate net cash flow for a rental property?
Follow these four steps:
- Start with Gross Rental Income
- Subtract vacancy and credit losses → Effective Gross Income (EGI)
- Deduct Operating Expenses → Net Operating Income (NOI)
- Subtract CapEx reserves and Debt Service → Net Cash Flow
What expenses should be included in a real estate cash flow forecast?
Standard line items include:
- Property management fees (even for self-managed properties)
- Insurance, property taxes, and maintenance
- Utilities not passed to tenants, CapEx reserves, and debt service
International properties add currency hedging costs, cross-border transaction fees, and local regulatory charges.
What vacancy rate should I use in my real estate cash flow forecast?
Use submarket-specific data rather than national averages. While 5–10% serves as a baseline for stable markets, adjust for property type, location, and market conditions. Tourist-driven markets experience seasonal patterns requiring higher annual vacancy assumptions.
How far in advance should I forecast real estate cash flow?
Use monthly projections for the first 12 months to manage near-term cash needs, then quarterly or annual projections for years 2–5. Treat years 2–5 as rough targets, not hard numbers — revisit them as market conditions and property lifecycle events unfold.
How does investing in international real estate affect cash flow forecasting?
International properties introduce currency exposure, local regulatory costs, foreign ownership rules, and market-specific vacancy and expense norms. Without local expertise and independent data, domestic benchmarks applied to foreign markets routinely understate costs and overstate returns.